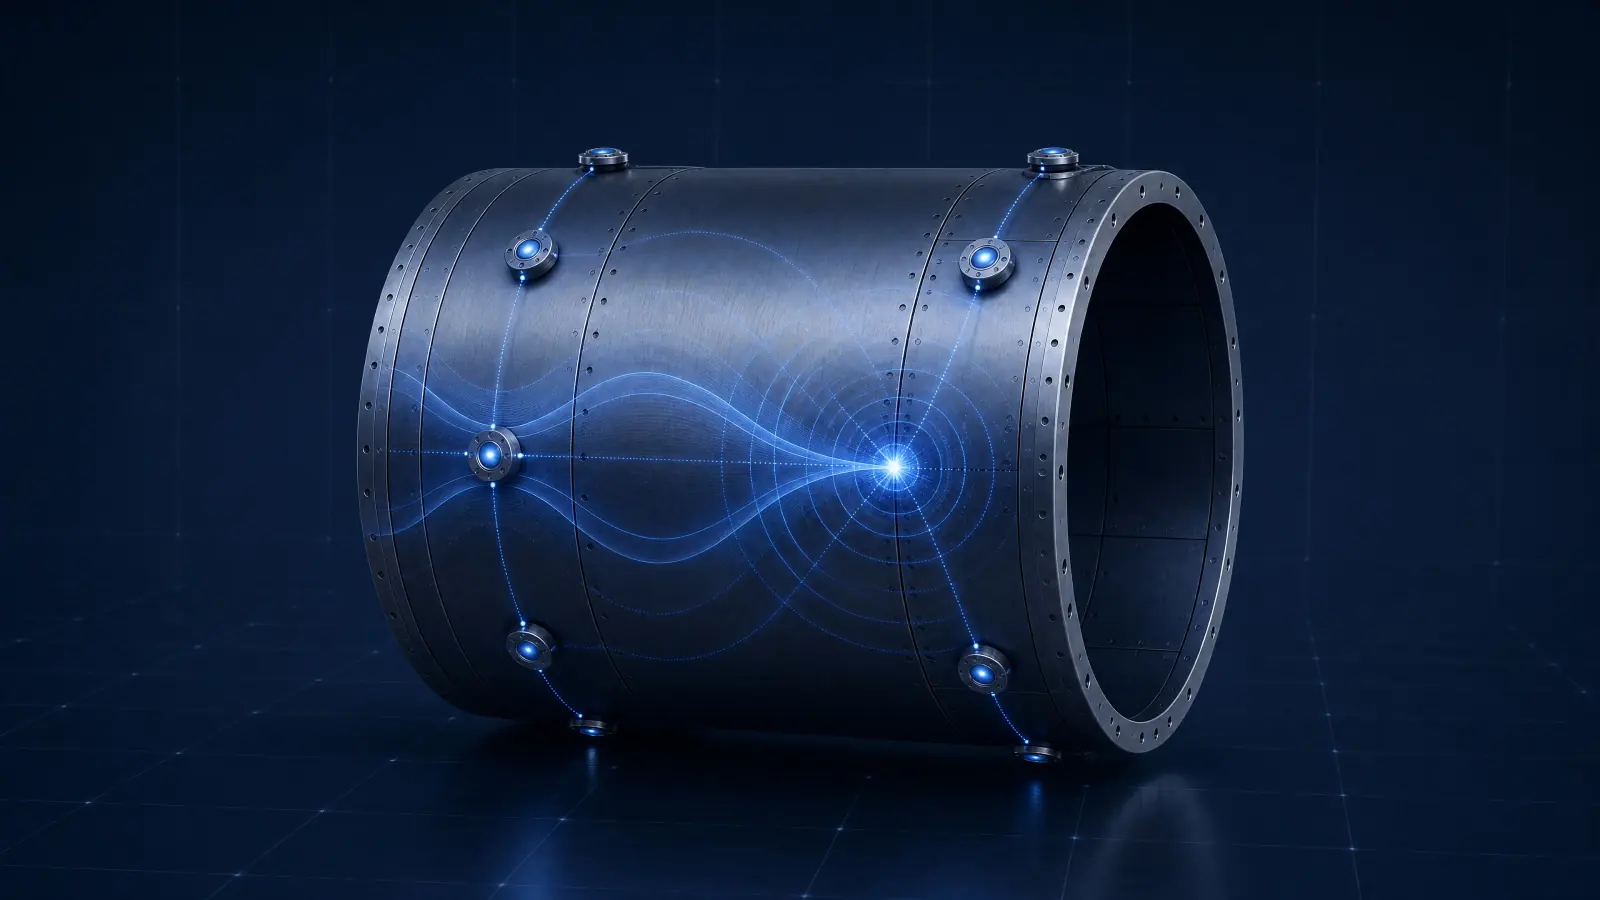
Deep Learning Approach to Impact Detection in Sensorised Panels
A fully data-driven machine-learning framework for impact localisation and classification on a cylindrical composite hydrogen tank, using passive sensing and physics-guided feature engineering.
MEng Aeronautical Engineering — Final Year Project / 2024–2025 / Imperial College London, Department of Aeronautics
Structural health monitoring (SHM) of aerospace-grade composite structures is increasingly difficult as material anisotropy and geometric complexity grow. Traditional physics-based localisation methods need detailed knowledge of material properties and structural configuration, which is hard to apply reliably in the real world.
This project proposes a fully data-driven machine-learning framework for impact localisation and classification using passive sensing on a cylindrical composite hydrogen tank — learning spatial patterns from measured response rather than from prior assumptions about the structure.
- Can passive sensor signals localise and classify impacts without prior knowledge of wave velocities or stiffness?
- Which engineered features carry the spatial and severity signal?
- How accurate and fast can a lightweight model be?
- Are the learned results physically consistent with wave behaviour?
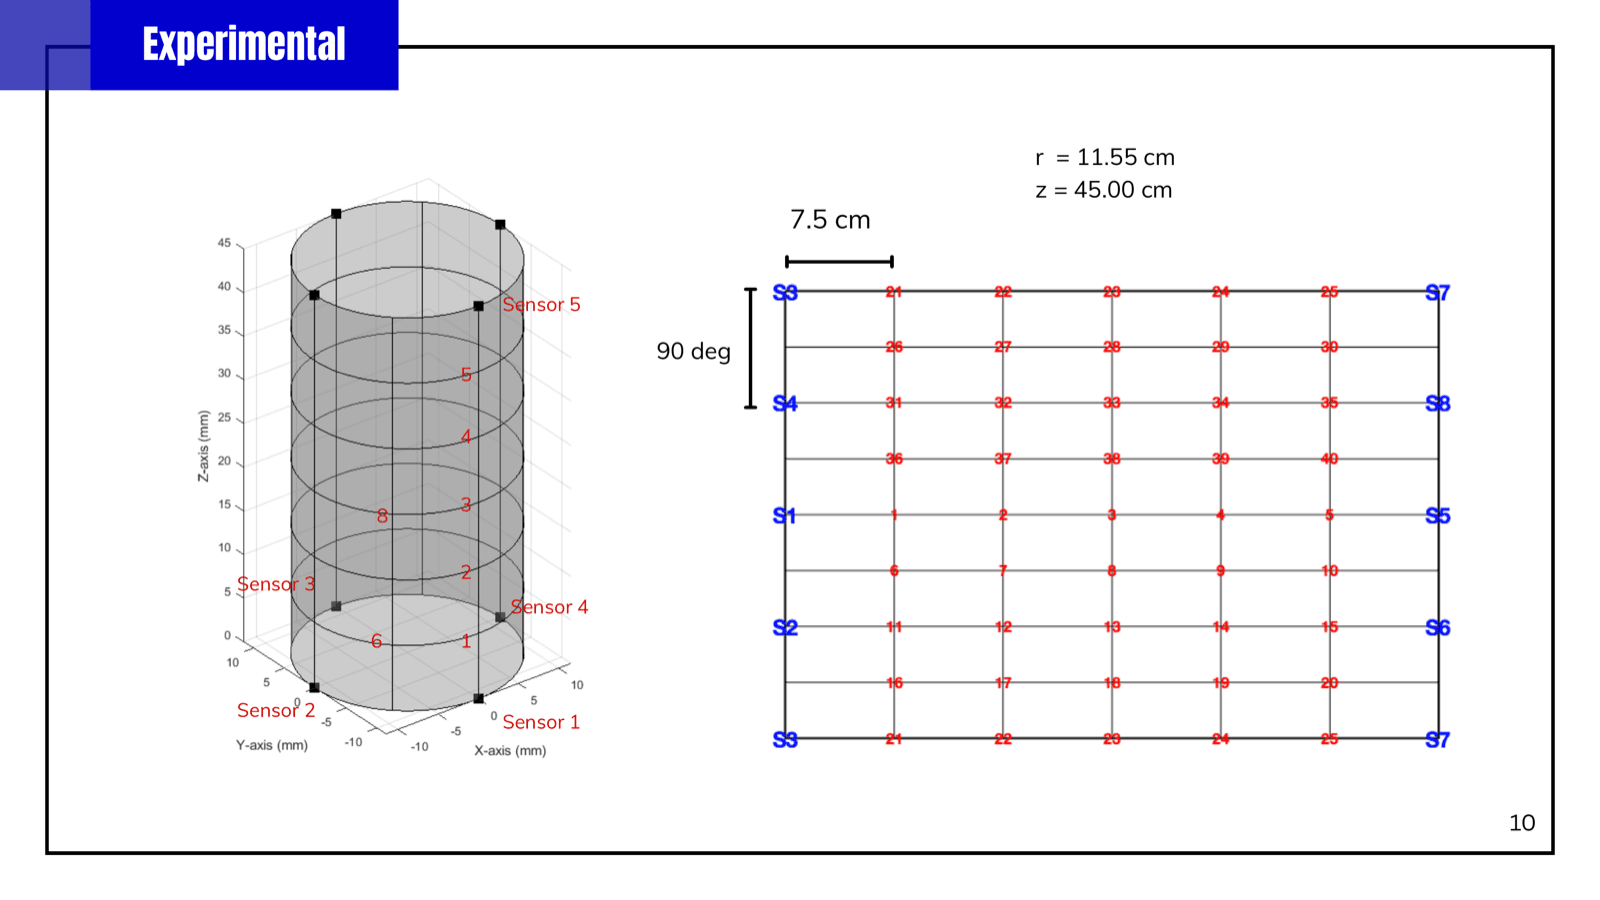
The test structure is a cylindrical composite tank — the central section of a hydrogen-storage vessel studied for future aerospace use (radius 11.55 cm, axial length 45 cm). Analysis is restricted to the uniform cylindrical region so that wave propagation stays consistent.
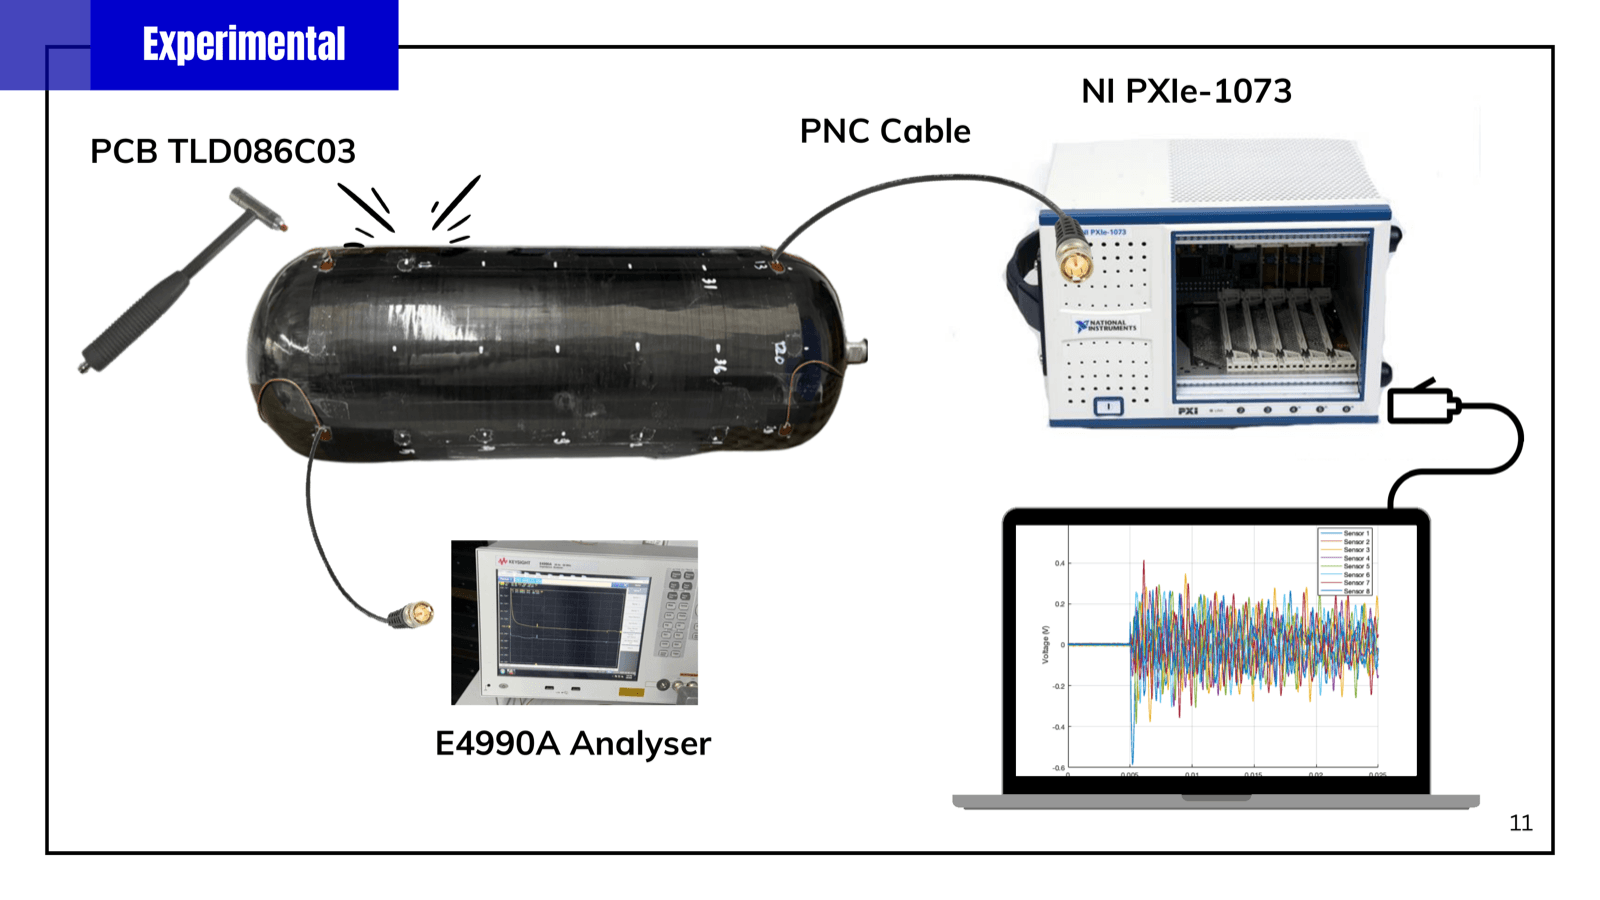
Eight piezoelectric (PZT) sensors are bonded to the surface, and impacts are applied at 40 distinct locations (five axial levels × eight angular positions). An instrumented PCB hammer with steel, silicone, rubber, and soft-rubber tips spans hard and soft contact conditions.
- 8 PZT sensors · 40 impact locations on the unwrapped cylinder
- NI PXIe data acquisition: 50,000 samples/channel per event at 2 MHz (25 ms window)
- Sensor bonding verified by impedance — resonance shifts to ~242.7 kHz when coupled
- Test sets A / B / C vary coverage and supports → configurations A+B, A+B+C, B+C (Full), B+C (Top)
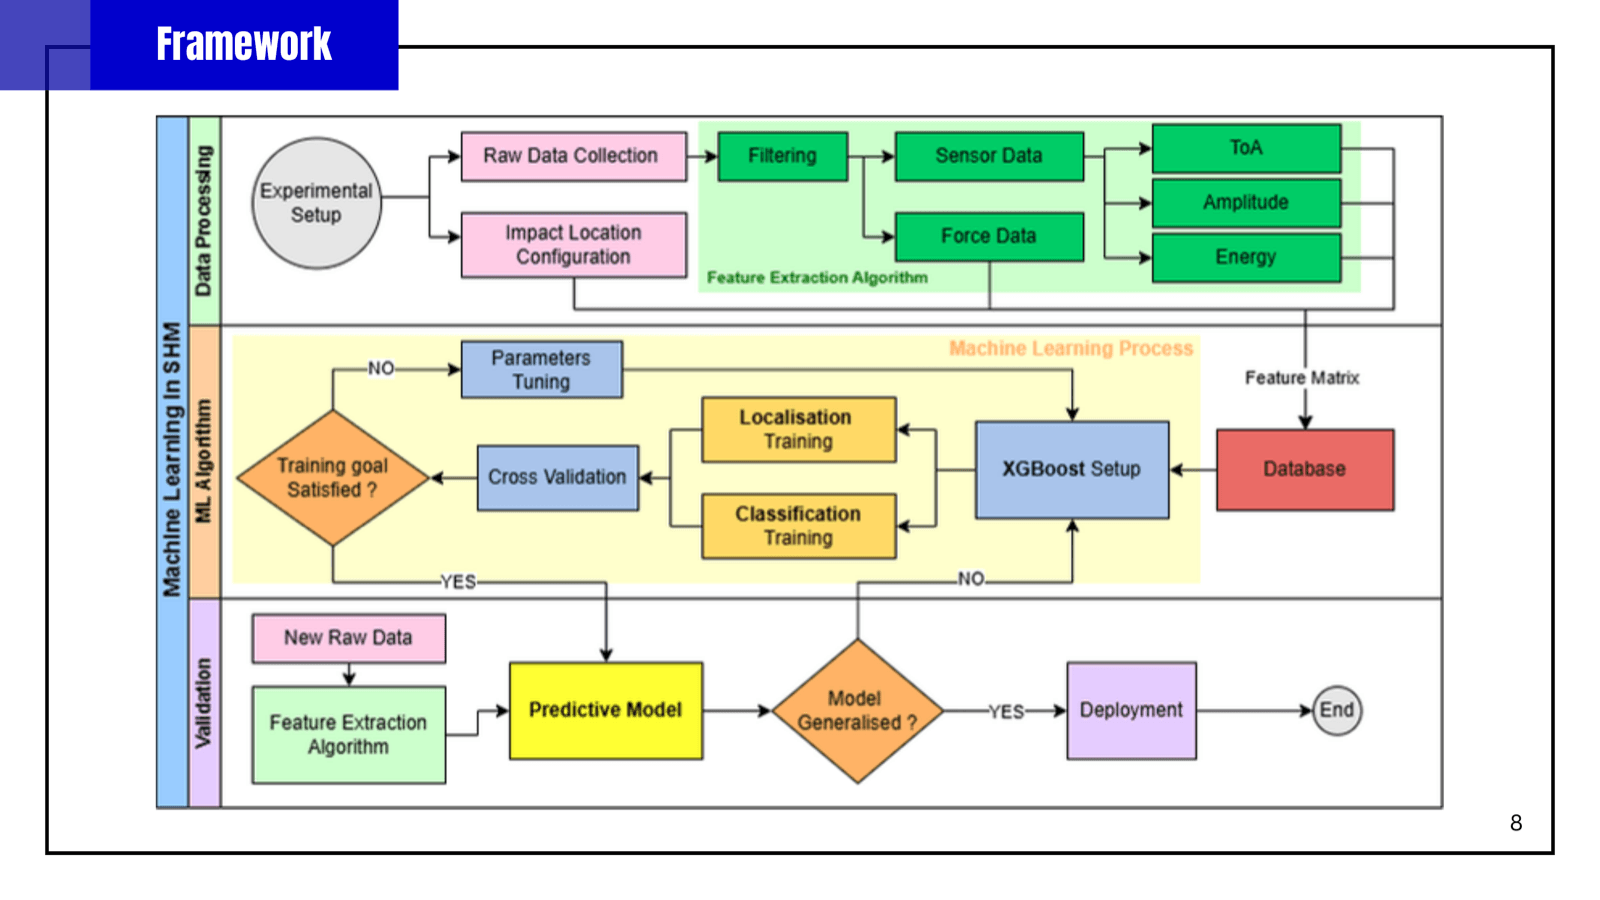
Physical insight was used only to guide feature engineering; the model then learned spatial patterns directly from the measured response.
- Feature engineering: time of arrival, amplitude, energy, peak frequency
- XGBoost for both localisation (regression) and soft/hard classification
- Geometry-aware encoding: angular targets as sin θ / cos θ to respect circular continuity
- Ambiguous mid-length locations identified and handled to improve reliability
- 10-fold cross-validation; group velocity back-calculated and ABAQUS FEA used to check physical consistency
On the held-out top region, the geometry-aware (sin/cos) encoding reached 1.59 cm spatial RMSE and 97.1% localisation accuracy within a 3.5 cm threshold — about a 12% error reduction over raw angular targets.
- Best 10-fold cross-validation: B+C (Top) — 1.07 cm RMSE, 93.9% accuracy within 3.5 cm (see tables below)
- Impact classification (soft vs hard): ~99.4% cross-validation accuracy; 99.6% on the B+C (Top) held-out test
- Resolving ambiguous mid-length locations lifts accuracy from 91.3% (ignored) to 97.1% (flagged) to 99.4% (removed)
- Fast inference: ~4.89 s (classification) and ~58.06 s (localisation) across the test set
- Physical consistency confirmed via back-calculated group velocity and ABAQUS FEA
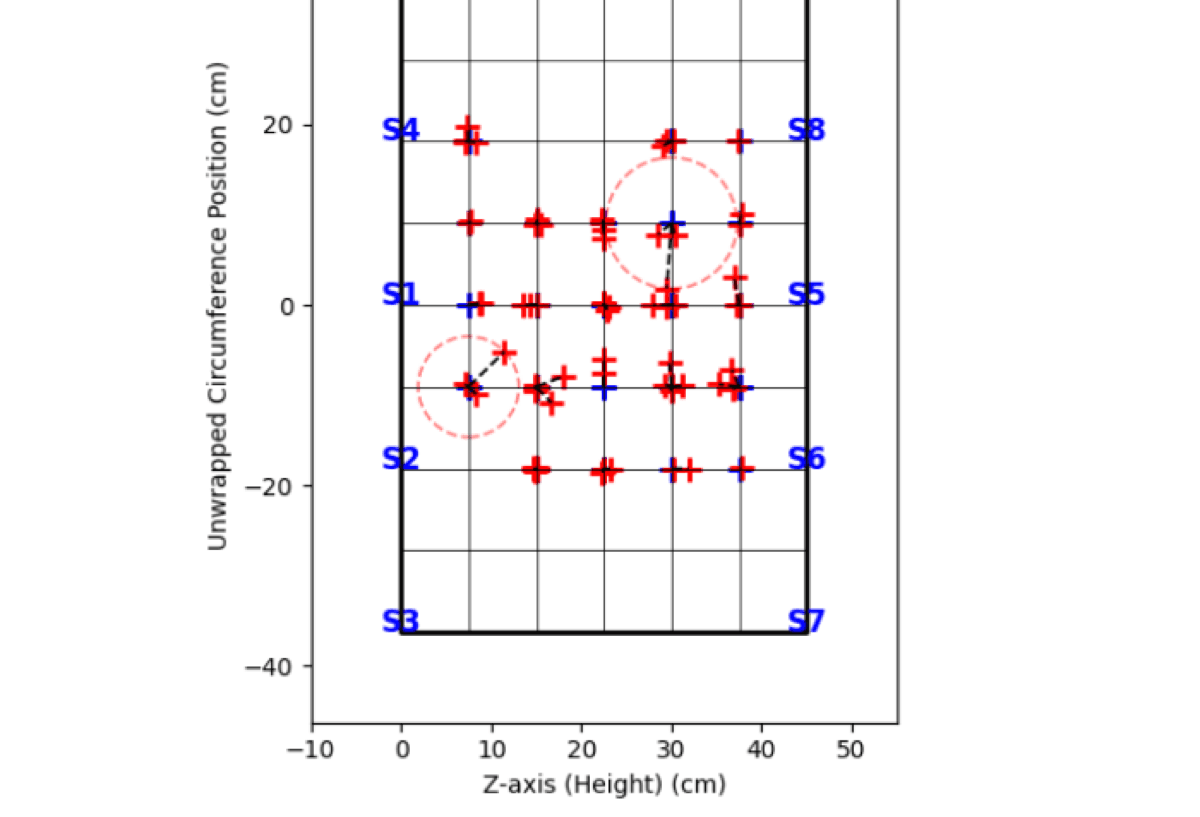
Feature-driven, geometry-aware machine learning makes non-intrusive SHM viable across complex structures with minimal prior design knowledge. The direction connects to hydrogen-tank integrity, aerospace safety, predictive maintenance, and digital-twin systems.
Impact Localisation
10-fold cross-validation; accuracy threshold is 3.5 cm localisation error.
| Sensor configuration | Spatial RMSE (cm) | Accuracy within 3.5 cm (%) |
|---|---|---|
| A + B | 1.94 ± 0.24 | 84.98 ± 3.53 |
| A + B + C | 1.35 ± 0.17 | 91.39 ± 2.78 |
| B + C (Full) | 1.39 ± 0.23 | 90.85 ± 2.28 |
| B + C (Top) | 1.07 ± 0.23 | 93.86 ± 2.25 |
Impact Classification
Soft versus hard impact classification under the same cross-validation setup.
| Sensor configuration | Classification accuracy (%) |
|---|---|
| A + B | 99.77 ± 0.36 |
| A + B + C | 99.47 ± 0.55 |
| B + C (Full) | 99.39 ± 0.86 |
| B + C (Top) | 99.36 ± 1.00 |